There were very few changes with Bond yields this week as markets continue to assess incoming data and the ongoing regional banking crisis to determine if the Federal Reserve’s most aggressive tightening cycle in 40 years is finally over. For the week, the 10yr yield fell 4bp to 3.40% while the 2yr was unchanged at 3.91% and the 3mo yield fell 6bp to 5.14%. The 10yr-3mo yield spread stands at -174bp, the most negative on record and clear indication the markets see a recession coming and the potential for rate cuts beginning in Q2.
This week began with the release of the latest Senior Loan Officer Survey from the Federal Reserve that showed banks tightening credit standards for C&I, CRE, and consumer loans even as loan demand fell again. Many economists worry the regional banking crisis that began with the failure of Silicon Valley Bank will cause further credit tightening as banks reign in lending and shore up liquidity. Tighter credit conditions and falling loan demand will add to the economic pain caused by 500bp of rate hikes and makes a recession in 2H 2023 more likely.
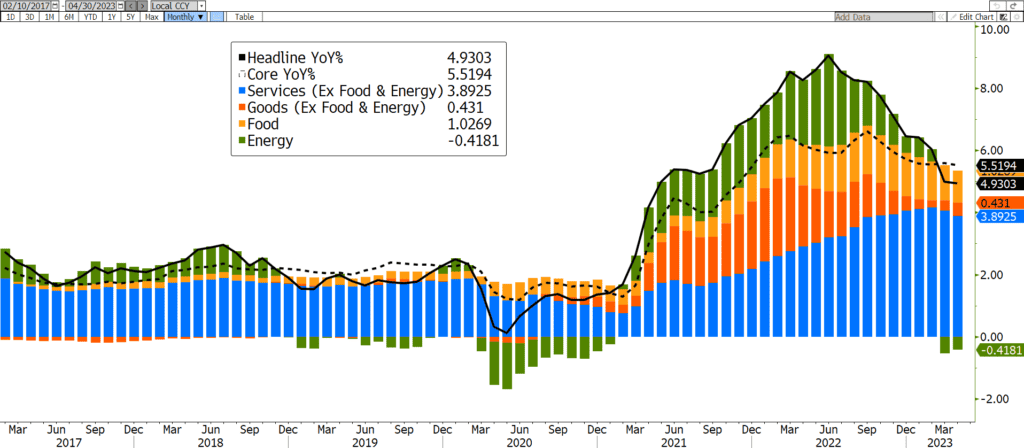
There was good news on the inflation front with both CPI and PPI coming in lower than expected on an annualized basis. CPI rose 4.9% from a year ago in April, down from a peak of 9.1% in June 2022 while PPI rose just 2.3%, down from a peak of 11.6% in March 2022. Inflation continues to fall towards the Fed’s stated target of 2%, but core inflation remains stubbornly high with Core CPI falling only slightly to 5.5%.
Tighter credit, weakening economic data, and falling inflation have all contributed to markets belief that the May rate hike will be the last and the Fed will be cutting rates in Q2. Current fed funds futures show just a 10% chance the Fed will hike rates in June, a 38% they will cut in July and a 76% they will cut by September.
Next week we’ll get a slew of economic data and no less than 14 speeches from Fed officials, increasing the potential for market volatility. On the data front, we’ll get reports on Retail Sales, Industrial Production, Housing Starts, Building Permits, Existing Home Sales, and Leading Economic Indicators. Maybe more importantly, all the Fed speeches will give us a better indication of whether Fed is finished raising rates or whether they believe more restrictive monetary policy is still necessary to bring inflation down to their target despite the increasing number of headwinds facing the economy. Stay tuned.
Annual CPI by Component Since 2017

Source: Bloomberg, L.P.
The Baker Group is one of the nation’s largest independently owned securities firms specializing in investment portfolio management for community financial institutions.
Since 1979, we’ve helped our clients improve decision-making, manage interest rate risk, and maximize investment portfolio performance. Our proven approach of total resource integration utilizes software and products developed by Baker’s Software Solutions* combined with the firm’s investment experience and advice.

Author
Ryan W. Hayhurst
President
The Baker Group LP
800.937.2257
*The Baker Group LP is the sole authorized distributor for the products and services developed and provided by The Baker Group Software Solutions, Inc.
INTENDED FOR USE BY INSTITUTIONAL INVESTORS ONLY. Any data provided herein is for informational purposes only and is intended solely for the private use of the reader. Although information contained herein is believed to be from reliable sources, The Baker Group LP does not guarantee its completeness or accuracy. Opinions constitute our judgment and are subject to change without notice. The instruments and strategies discussed here may fluctuate in price or value and may not be suitable for all investors; any doubt should be discussed with a Baker representative. Past performance is not indicative of future results. Changes in rates may have an adverse effect on the value of investments. This material is not intended as an offer or solicitation for the purchase or sale of any financial instruments.