At the onset of the COVID-19 pandemic in the United States, strict shutdowns and stay-at-home orders created concern for the economy and municipal finances. Forecasts for tax revenue were bleak with anticipated double-digit declines, and many state and local governments braced for a serious financial blow by adjusting budgets, cutting expenses, and delaying non-essential projects. More than a year has passed since the beginning of the pandemic, many governments have published financial statements that include at least a portion of the pandemic, and we now have much more data about how the pandemic has affected municipal credit quality.
Interestingly, tax revenues did not fall near as much as expected. Total state tax revenue was down by almost 1% in 2020 versus 2019 according to US Census data, which was much less than originally feared, and half of states actually had an increase in their total tax revenue. Property tax revenue grew by about 4.1% on average, but general sales taxes and special sales taxes declined by 1.6% and 3.5%, respectively. Zillow reports that average home values across the US increased by 13.2% over the past year. So, although property tax trend changes tend to lag economic changes, property tax revenue - the main revenue source for most local governments - may not be negatively affected by the pandemic.
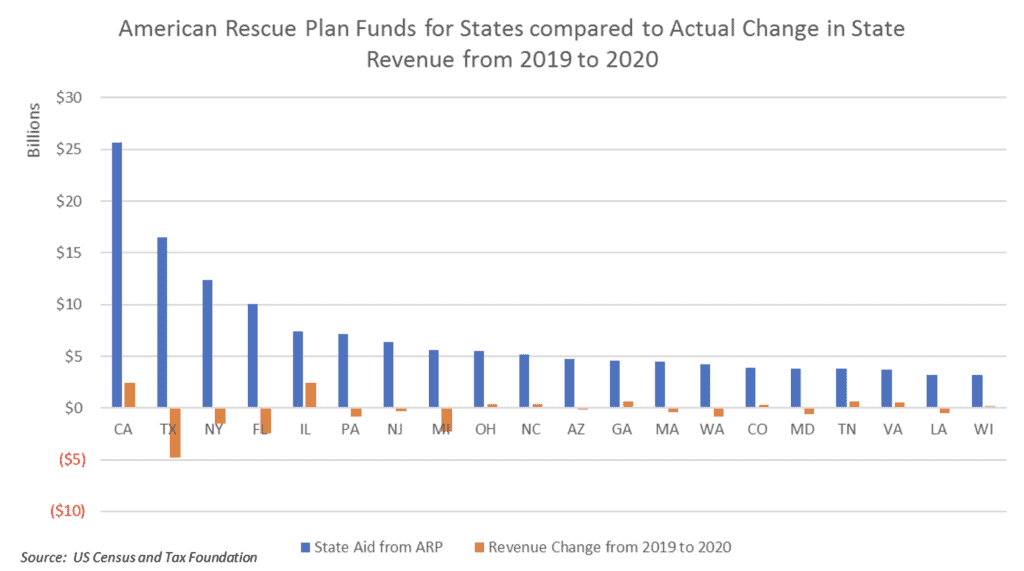
The CARES Act in 2020 supported consumer spending, and thereby sales tax revenues, with $290 billion of payments to consumers and $270 billion in expanded unemployment benefits. According to the Bureau of Economic Analysis, transfer payments to individuals were the main reason personal income increased by 6.1% in 2020 despite very high unemployment. The CARES Act further boosted municipal revenues in 2020 by providing $150 billion directly to state and local governments, and the American Rescue Plan (ARP) Act, passed in March 2021, provided another $350 billion to state and local governments, which will help to strengthen municipal credit quality in the 2021 fiscal year as well. Of the $350 billion designated for state and local governments, $195 billion was allocated for states, which is over 30 times the aggregate decline in tax revenue from 2019 to 2020. However, some states may experience greater declines in tax revenue in 2021, given that most of the pandemic occurred during the 2021 fiscal year rather than the 2020 fiscal year. Exhibit 1 breaks down the comparison of 2020 tax revenue changes and ARP Act funding by state for the largest 20 recipients of the ARP funds.
Exhibit 1

Over 90% of transportation bonds, 40% of higher education, and 20% of states had a negative outlook or experienced a downgrade by S&P during 2020, but that trend seems to have reversed so far in 2021. S&P revised the outlooks of general Public Finance sectors such as states, local governments, and school districts from negative to stable in early 2021. Also, during the first five months of 2021, Connecticut was upgraded by S&P; Alaska, New Mexico, Oklahoma, and Illinois all had outlooks revised from negative to stable by S&P; and The Baker Group’s clients experienced 1.6 upgrades for every downgrade in the first five months of 2021 compared to 0.77 upgrades per downgrade in 2020.
Despite all this good news about the credit quality of the muni market broadly, some specific issuers did struggle. According to Bloomberg data, there were $2.1 billion of defaults during 2020 (0.05% of the $3.9 trillion municipal market) and an additional $4.5 billion that was considered distressed compared to only $1.4 billion of defaults in 2019 and an additional $1.7 billion that was distressed. Of the 2020 defaults, 53% were issuers in the healthcare industry and 29% were deals related to special development purposes. So far in 2021, over half the defaults are once again in the health care industry. Notably, none of the defaults in 2020 or 2021 were general obligation or essential purpose revenue bonds.
The positive news generally seems to outweigh the negative, but investors should not let their guard down yet. General obligation bonds and essential purpose revenue bonds continue to prove resilient, but other types of revenue bonds remain vulnerable.
The Baker Group is one of the nation’s largest independently owned securities firms specializing in investment portfolio management for community financial institutions.
Since 1979, we’ve helped our clients improve decision-making, manage interest rate risk, and maximize investment portfolio performance. Our proven approach of total resource integration utilizes software and products developed by Baker’s Software Solutions* combined with the firm’s investment experience and advice.

Author
Dana Sparkman, CFA
Executive Vice President/Municipal Analyst
The Baker Group LP
800.937.2257
*The Baker Group LP is the sole authorized distributor for the products and services developed and provided by The Baker Group Software Solutions, Inc.
INTENDED FOR USE BY INSTITUTIONAL INVESTORS ONLY. Any data provided herein is for informational purposes only and is intended solely for the private use of the reader. Although information contained herein is believed to be from reliable sources, The Baker Group LP does not guarantee its completeness or accuracy. Opinions constitute our judgment and are subject to change without notice. The instruments and strategies discussed here may fluctuate in price or value and may not be suitable for all investors; any doubt should be discussed with a Baker representative. Past performance is not indicative of future results. Changes in rates may have an adverse effect on the value of investments. This material is not intended as an offer or solicitation for the purchase or sale of any financial instruments.