The global pandemic set into motion a series of historically unprecedented economic policies. Massive amounts of liquidity and stimulus from policymakers enabled a fast recovery, but at what financial cost? The side effect of those “easy money” conditions has been 40yr-high inflation that now must be fought through highly restrictive Fed behavior. Balance sheet managers have been left to deal with the resulting large swings in interest rate and liquidity risks. Rapidly increasing cost of funds, stubborn loan rates, and ever-tightening margins are just a few of the most common worries for 2023. Reviewing industry figures from 2005 – 2007, the last time yields were around these levels, could help us better understand and prepare for what might be ahead.
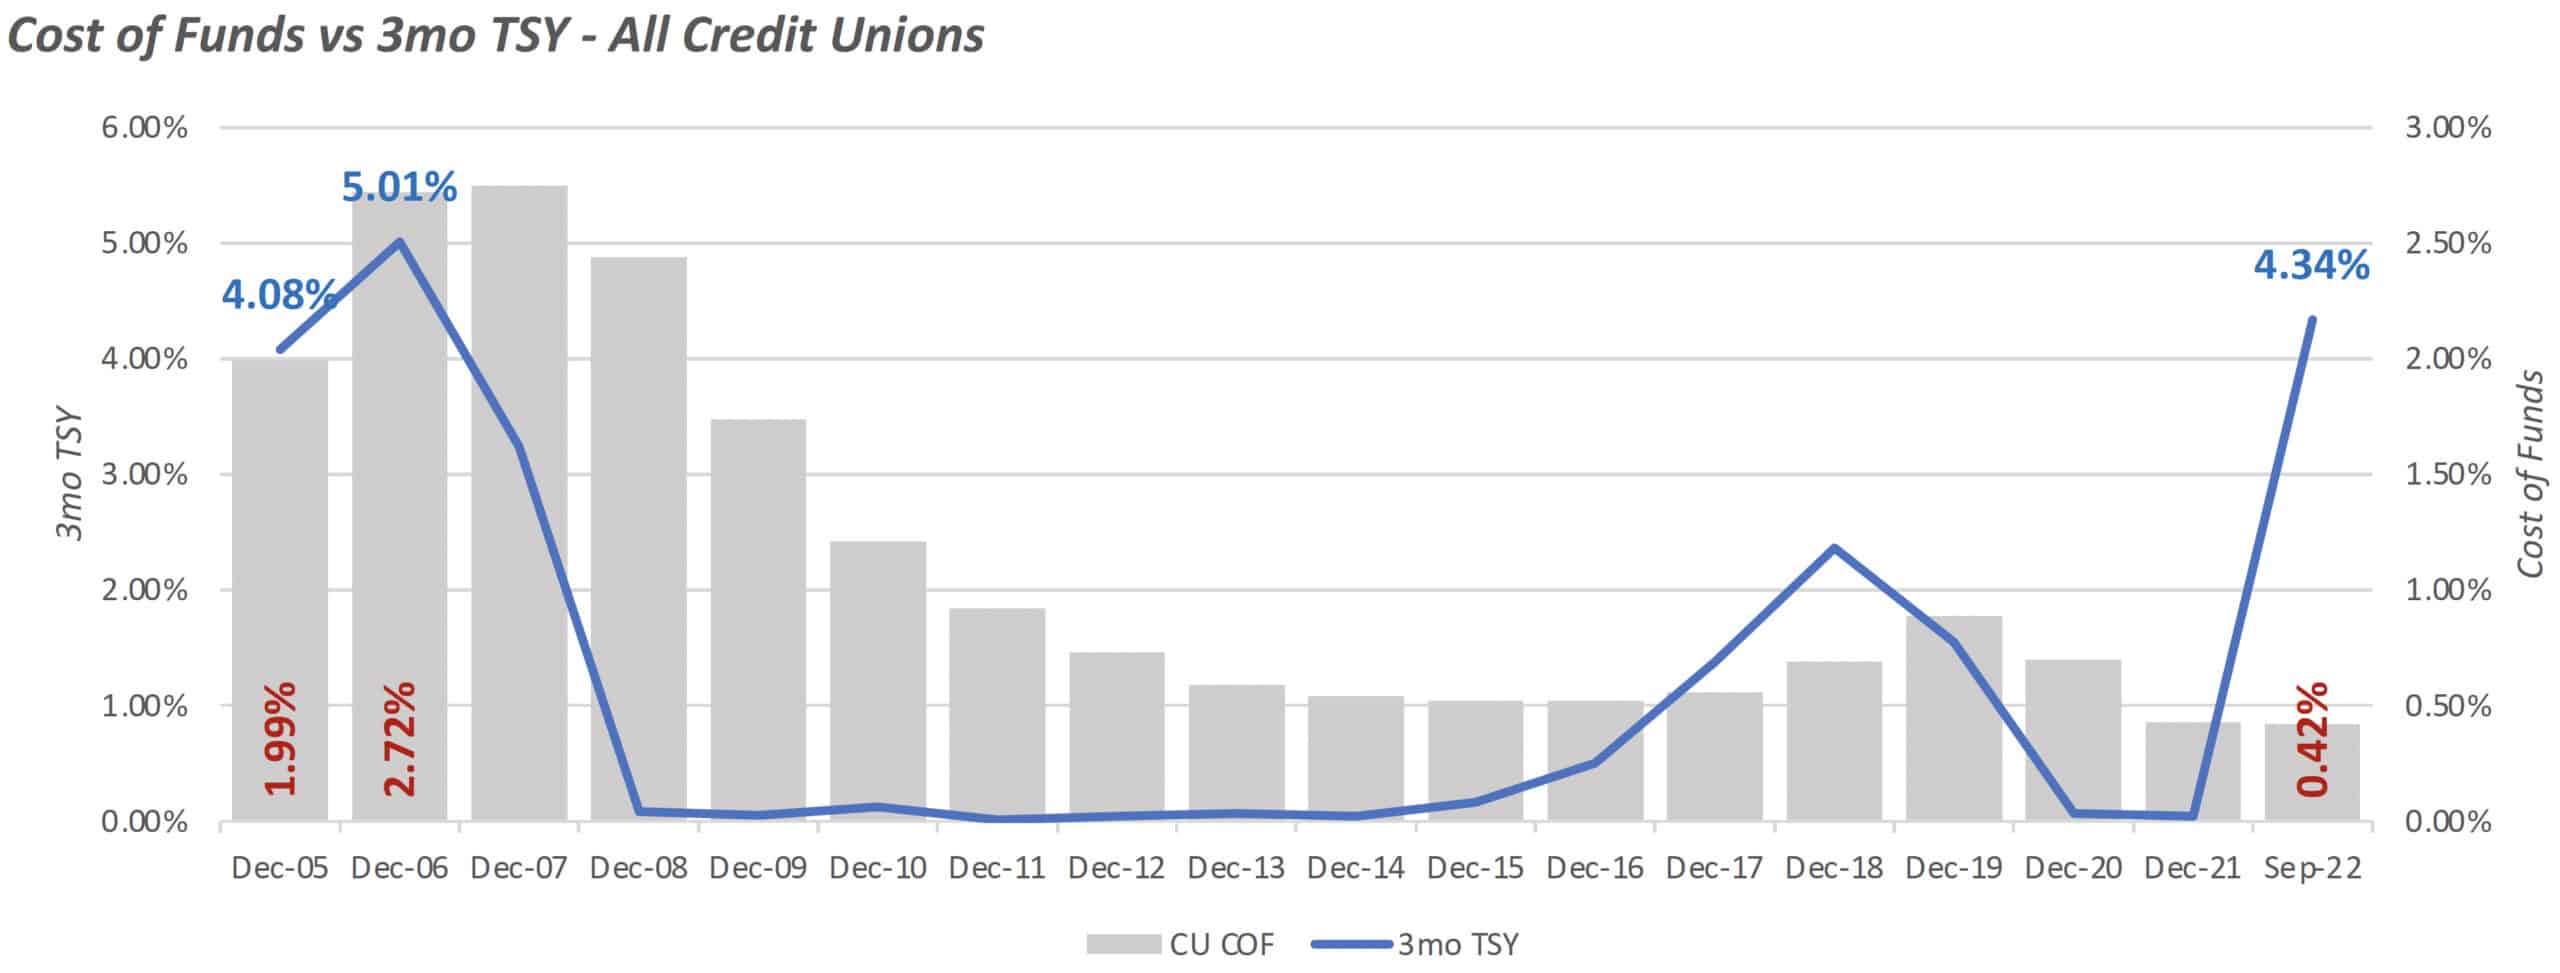
Just how much margin pressure should we expect from cost of funds in 2023? Well, if we take a look back at the last time the 3mo treasury was north of 4%, the industry cost of funds was between 1.99% and 2.72%. While I don’t expect us to reach those levels in just twelve months, it is certainly possible, given wholesale funds near 5% and CD specials already north of 4%. For strategic planning, budgeting, and asset pricing purposes, we should be assuming a large increase in cost of funds over our current 0.43% level.

*Data from Bloomberg & NCUA 5300 Call Reports
Balance sheet managers have to remember that time is not their friend when it comes to managing margin. Increasing our average loan yield takes a good amount of time from the initial change in offering rates. Especially for longer, fixed rate loans that are already on the books and not repricing anytime soon. On the other side of things, increases in cost of funds are felt immediately across all balances. The one main exception is CDs. However, with CD specials we need to factor in deposit cannibalization from lower rate deposit accounts.

*Data from Bloomberg & NCUA 5300 Call Reports
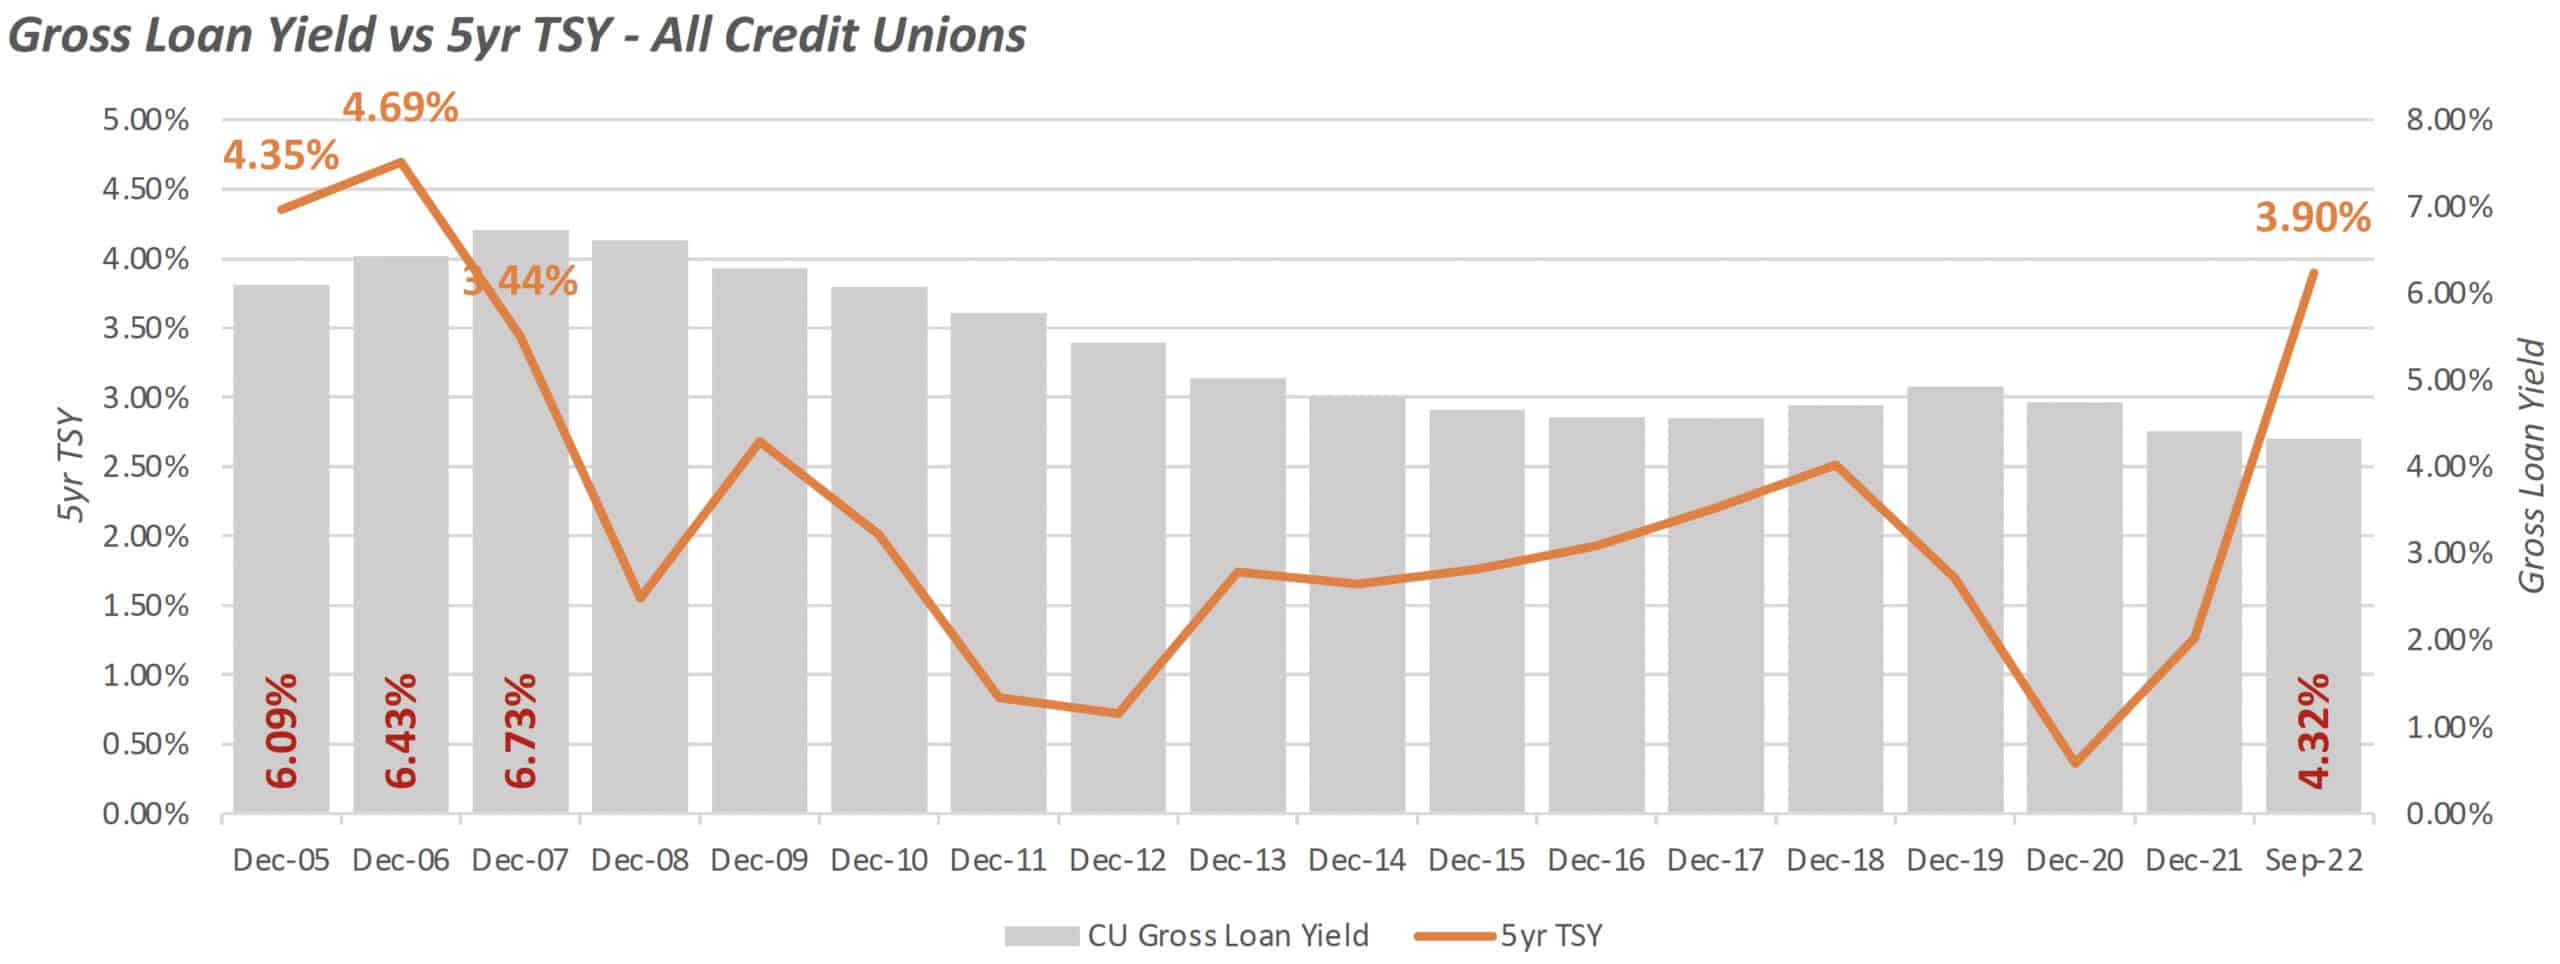
One way we can begin to prepare for that eventual hit to margin is by reviewing our current asset pricing. The second chart shows just how much room we have to cover there. The last time the 5yr treasury was around 4%, the industry’s gross loan yield was between 6.09% and 6.73%. With our current loan yield at just 4.32%, we have the opportunity to cover the majority (if not all) of next year’s deposit price increases. Keep in mind that these are gross loan yield figures. They do not include cost of servicing or provision for loan losses, both of which should be included in your internal pricing reviews.
No matter how you look at it, there is an immediate need to begin increasing your yield on earning assets to get ahead of the expected cost of funds increases. The sooner the better for loan pricing increases given their lagged impact. Investment yields have done a nice job keeping up with interest rate movements but have recently fallen back versus wholesale fund levels. However, those dollars also offer significantly more downside margin protection for those with asset-sensitive ALM results.
Regardless of how strong or weak your 2023 budget results look, these large shifts in loan yields and cost of funds need to be factored in. Although the Fed’s recent speed of rate change is unprecedented, this isn’t anything that the industry has not faced in the past. We have survived rate environments well above 5%. What we haven’t done to date is move our asset and deposit prices at anywhere near the same pace and it shows.
At the end of the day, we operate on margin. So, neither cost of funds nor yield on earning assets matter by themselves. If we can catch up and keep our asset prices on par with overall interest rates, we should have more than enough room to pay proper deposit rates and still maintain our preferred 2.5%/3%+ margins. More than ever, it is critical that credit union leadership takes a whole balance sheet approach, as understanding and utilizing wholesale markets (asset and funding) could significantly reduce some of these pressures. For those with ultra-competitive local loan markets, loan participations are readily available above 6% yields.
What is clear is that IRR and liquidity pressures aren’t likely going away in 2023. However, with a more proactive approach to rate pricing and overall balance sheet strategic planning, it is possible to increase performance and separate your credit union from the pack.
The Baker Group is one of the nation’s largest independently owned securities firms specializing in investment portfolio management for community financial institutions.
Since 1979, we’ve helped our clients improve decision-making, manage interest rate risk, and maximize investment portfolio performance. Our proven approach of total resource integration utilizes software and products developed by Baker’s Software Solutions* combined with the firm’s investment experience and advice.

Author
Andrew Okolski
Managing Director
The Baker Group LP
800.937.2257
*The Baker Group LP is the sole authorized distributor for the products and services developed and provided by The Baker Group Software Solutions, Inc.
INTENDED FOR USE BY INSTITUTIONAL INVESTORS ONLY. Any data provided herein is for informational purposes only and is intended solely for the private use of the reader. Although information contained herein is believed to be from reliable sources, The Baker Group LP does not guarantee its completeness or accuracy. Opinions constitute our judgment and are subject to change without notice. The instruments and strategies discussed here may fluctuate in price or value and may not be suitable for all investors; any doubt should be discussed with a Baker representative. Past performance is not indicative of future results. Changes in rates may have an adverse effect on the value of investments. This material is not intended as an offer or solicitation for the purchase or sale of any financial instruments.